


Solar Power in the Netherlands: Why Your P1 Meter and Inverter Disagree
- November 10, 2026
- 0
Your solar app says the roof produced 10 kWh yesterday. Your Dutch smart meter shows that you sent 6 kWh back to the grid. Where did the other

Your solar app says the roof produced 10 kWh yesterday. Your Dutch smart meter shows that you sent 6 kWh back to the grid. Where did the other
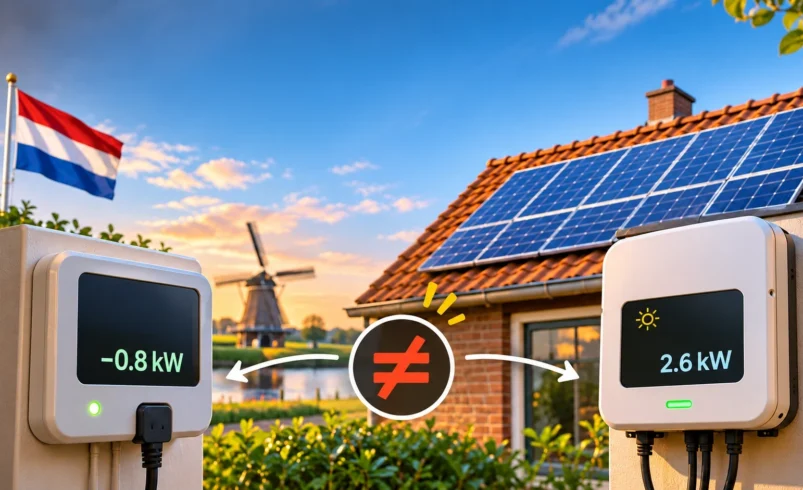
Your solar app says the roof produced 10 kWh yesterday. Your Dutch smart meter shows that you sent 6 kWh back to the grid. Where did the other 4 kWh go? In a home with one solar installation, no battery and comparable readings for the same period, you used those 4 kWh at home. The inverter counted them as production. They never crossed the grid meter on their way to your appliances.
That distinction matters when you install a P1 reader in the Netherlands. The reader can show when your home draws electricity from the grid or feeds electricity back. The inverter measures output from your panels. Put the two records together and you can answer a more interesting question than which app is right. How much of yesterday’s electricity demand did your roof actually cover?
Picture a dishwasher drawing power while the panels are producing electricity. Some of that production supplies the dishwasher and other loads in the house. Any surplus can flow out to the grid. If the home needs more than the panels provide at that moment, the shortfall comes from the grid. The smart meter sees the exchange at that boundary. It has no separate view of the dishwasher.
The P1 port is a way to read data from the smart meter. Adding a reader does not move the point where electricity is measured. A P1 app can give you a useful picture of grid exchange even when it has no connection to your inverter. To show both production and household consumption, a monitoring system also needs a suitable production measurement or integration.
In a Dutch solar app, opwek or opbrengst often refers to generation. On a meter or energy dashboard, teruglevering refers to electricity delivered back to the grid. Afname is electricity drawn from the grid. Verbruik can be trickier. An app may use it for grid purchases, household consumption or the consumption of a specific device. Check the definition in that particular view.
Read the unit beside the value. A display of 800 W describes power at that instant. A daily figure of 8 kWh describes energy accumulated over time. A kettle running for a few minutes can move the live reading sharply while making a much smaller change to the daily total. To compare a day in two apps, use energy totals from both. To investigate a live event, use power readings from the same moment.
Liander’s guide explains how to identify the electricity registers on the meter. On a meter using these codes, 1.8.1 and 1.8.2 record imported energy in the two tariff registers. The corresponding export registers are 2.8.1 and 2.8.2. Use the instructions for your meter model if the display cycles quickly or the labels differ. There is no need to open the meter housing to read the screen.

These are cumulative totals. A figure of several thousand kilowatt-hours is unlikely to represent a single Tuesday. For each register, subtract its reading at the start of your chosen period from its reading at the end. Add the two import differences to find the period’s grid import. Add the two export differences to find its grid export. A register that does not change contributes zero to that calculation.
Suppose a home in Utrecht records 10 kWh of inverter production, 6 kWh of grid export and 3 kWh of grid import over the same complete day. It has one inverter, no battery and no other generator. Subtract export from production. The home used 4 kWh of solar generation directly. Add the 3 kWh imported from the grid. That gives 7 kWh of household consumption.

Those numbers describe a home that exported more electricity than it imported and still bought electricity during the day. There is no contradiction. At noon the panels could have produced more than the appliances needed. After sunset the family could have cooked dinner using electricity from the grid. A daily total folds those very different hours into one number.
There are also two honest answers to “what percentage was solar?” The home kept 4 of the 10 kWh it generated, so its solar self-consumption was 40 percent. Solar supplied 4 of the 7 kWh the home used, so its self-sufficiency was about 57 percent. Write down the denominator before comparing percentages from different dashboards. HomeWizard’s explanation of its self-sufficiency graph is helpful when using that particular app.
Pick a completed day in both apps. Write down the date, local time zone and measurement source beside each number. Take the inverter’s daily AC production and the P1 app’s daily import and export. If you are reading the physical registers instead, choose a future start and end time that you can observe on both devices. A meter reading taken at breakfast cannot reconstruct the exact midnight reading on its own.
Check the three figures with the simple balance above. If the result looks plausible, repeat the exercise on a day with different weather. A sunny day away from home may send a large share of production to the grid. A less sunny day spent doing laundry might keep a larger share at home. A lower production figure can coexist with a higher percentage of solar used directly.
When comparing with another household, ask what information its monitoring app receives. A neighbour who has linked an inverter as well as a P1 reader may see a household-use graph that your P1-only setup cannot calculate. The missing curve can be a missing measurement. It need not mean the meter is defective or that you chose the wrong electricity supplier.
Start with the date range. One app may display a rolling 24 hours and another a calendar day. Check that yesterday’s production data has finished syncing. Look for gaps when the inverter or reader lost its network connection. A flat line in an app can represent missing data even though the physical meter kept measuring electricity.
Next, check the scope of the production number. If you have two inverters, one portal login might show only one of them. If the same production source has been added twice to a monitoring dashboard, its calculated totals can be inflated. Compare the app’s device list with the installation you actually have. HomeWizard documents several checks for unexpected results in its self-sufficiency graph.
If the meter shows export over a full day while the selected inverter shows no production, record the precise interval, the register values and any gaps before drawing a conclusion. A screenshot with a date, unit and device name gives the installer considerably more to investigate than a message saying the graphs look different.
A home battery can store solar energy at midday and provide it after sunset. Some installations can also charge from the grid. With storage, subtracting daily grid export from solar production no longer tells you how much solar electricity appliances used directly that day. Some energy may still be in the battery at the end of your chosen interval.

Use the battery system’s charge, discharge and state-of-charge information together with the manufacturer’s definitions. Check whether the displayed inverter number measures solar generation, combined inverter output or a point that also sees battery flows. Two devices can legitimately report different energy totals when they measure different points in the installation.
Suppose you can run the dishwasher at lunchtime or in the evening. Watch the grid reading on a day when the roof is exporting. Start the cycle and see whether export falls or import begins. Repeat on another day with similar sunlight. Clouds, other appliances and the heating stage of the cycle can all affect what you see, so avoid treating one instant as the energy use of the entire wash.
If you want to know the effect on your bill, keep the physical readings separate from the pricing calculation. The meter records kWh. The contract determines how the supplier prices imports and exports for the relevant billing period. A graph showing increased self-consumption tells you about energy flows. Put your own current contract alongside those readings before assigning them a value in euros.
Save a small record with the period, solar production, grid import and grid export. Add a note if you changed an inverter, installed storage or lost monitoring data during the period. Future comparisons are much easier when you can tell a change in household behaviour from a change in what the monitoring system sees.
If you remember only one check, ask where the number was measured. At the inverter it can describe what the roof supplied. At the grid meter it describes electricity passing between the house and the network. Once both readings cover the same period and their units match, the difference starts to tell you something about life inside the house.
Imagine that you wrote down all four registers on Sunday evening and repeated the readings at the same time on Monday. Import register one rose by 2 kWh and import register two rose by 1 kWh. The two export registers rose by 2 kWh and 4 kWh. Over that interval, your home imported 3 kWh and exported 6 kWh. These figures tell you about grid exchange even if your inverter portal is temporarily offline.
Can you now say exactly how much electricity the house used? Only if you also have the generation figure and understand the rest of the installation. If production was 10 kWh for the identical interval in a simple home without storage, the result is 7 kWh of household demand. If the only production figure you have runs from midnight to midnight, keep it in a separate column until the periods match.
This exercise is also a useful check after replacing a phone or reinstalling an app. The app may begin its history on the day you connected it. The meter registers describe energy accumulated by that meter over a much longer period. Record a fresh starting point and work forward. You do not need to reconstruct years of missing graphs to check whether today’s measurements make sense.
Look at a short interval during which the household load stays reasonably steady. A cloud passes, solar output falls and the house draws more from the grid. When the sun returns, import may fall again. This sequence helps explain the relationship between the devices without requiring either graph to follow the other exactly. Different sampling intervals can make the same event appear a little earlier in one app.
Do the reverse after sunset. In a home without a battery or another generator, expect the appliances that are running then to draw from the grid. You can use this observation to check your understanding of the sign convention. On some displays a negative value indicates export. Another dashboard may draw the export curve above zero and label it separately. Read the legend before assigning meaning to the direction of a line.
Can I work out household consumption from export alone? No. Export tells you what left the property. A day with low export could mean very little sunshine, high household demand or a combination of the two. Add production and import over the same period before choosing an explanation. If there is storage, you also need the storage flows.
Why can two neighbouring houses with similar panels have different export? Compare when someone was at home, which appliances were running, how much each roof actually generated and whether either house stores energy. Identical export figures would tell you very little about those differences. For a fair comparison, record production first and then ask how much stayed on each side of the meter.
What should I send support if a graph appears impossible? Send the date and unit, identify the devices supplying the figures and give one complete interval with import, export and production. Say whether the installation has a battery, multiple inverters or a recent meter change. Keep customer numbers, addresses and meter serial numbers out of any public forum screenshots. A support team that needs an identifier can ask for it through its own support channel.
Liander guide to reading meter registers
HomeWizard guide to self-sufficiency
HomeWizard troubleshooting guide
More European technology guides from Bravlo
Ahmad Hassan covers everyday technology for Bravlo, explaining how readers can interpret the measurements and labels they encounter at home.